

Portfolio Analytics to Visualize Investments, Performance, and Dividend Insights
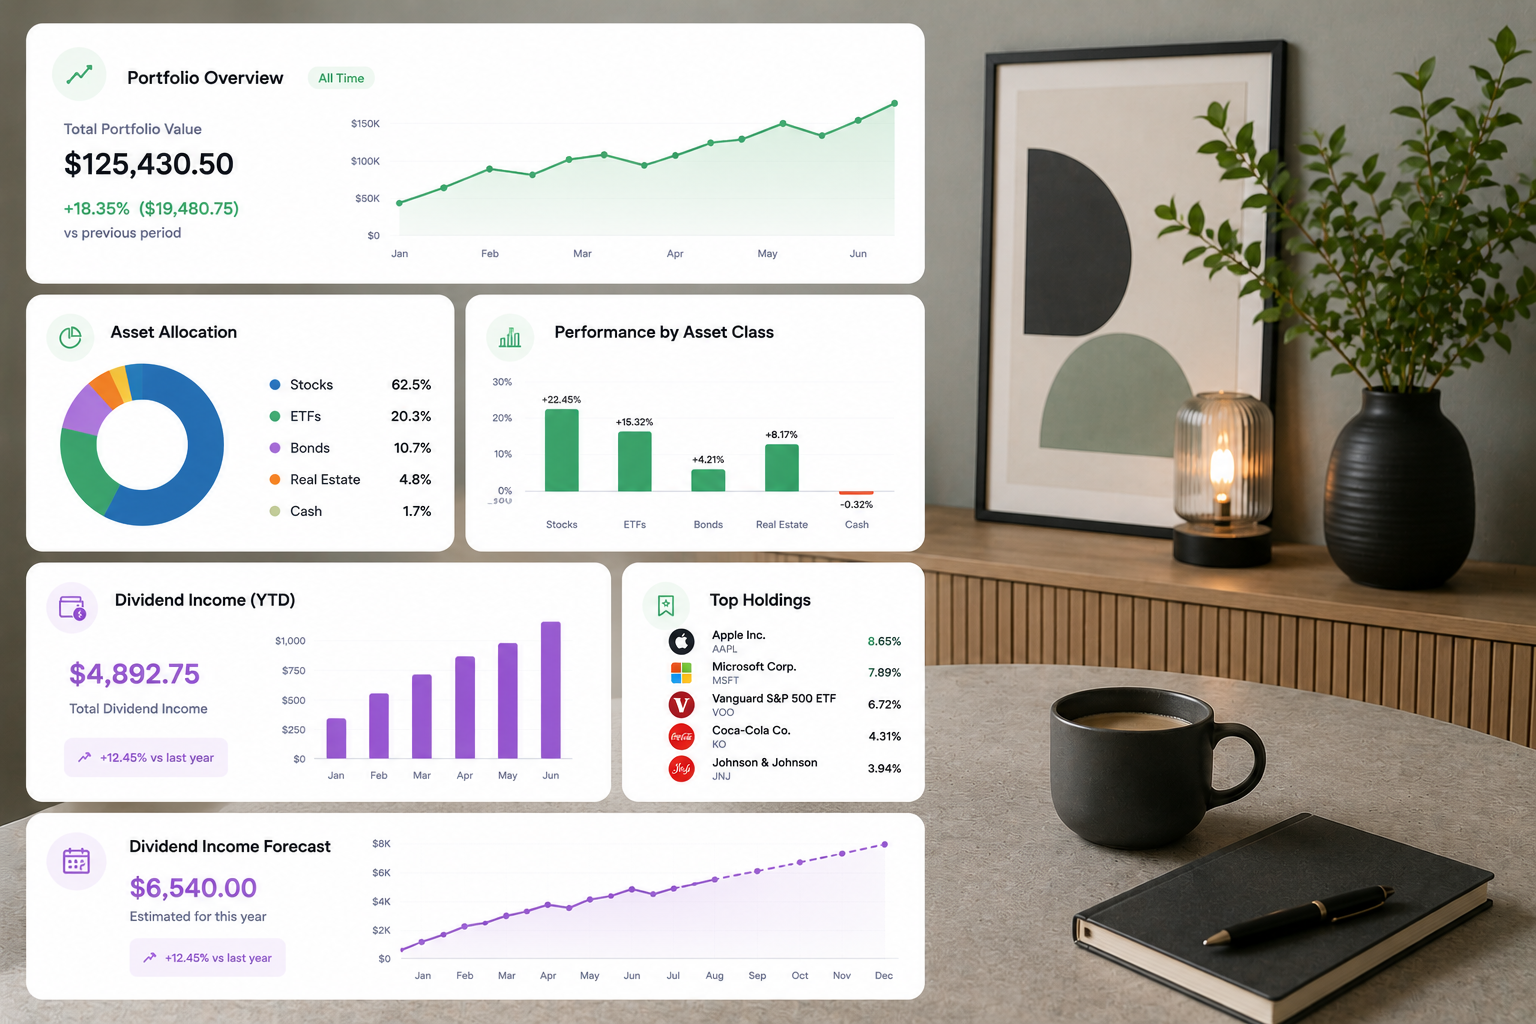
Better investment decisions start with better visibility. Zavzu provides portfolio analytics that help investors visualize performance, understand holdings, track dividend income, and turn investment data into clear insights.
Turn Portfolio Data Into Clear Insights
Zavzu helps investors move from raw data and spreadsheets to visual portfolio analytics that are easier to understand and act on.
Analyze Performance and Allocation
Understand how your portfolio is performing, where your investments are allocated, and how different holdings contribute to your results.
Visualize Dividend Income
Combine portfolio analytics with dividend tracking to see income patterns, upcoming payments, and recurring cash flow more clearly.
Make Data-Driven Investment Decisions
Zavzu gives investors the analytics and visualizations they need to stay organized, reduce manual work, and make more confident decisions.
Got Questions? Look Here
What is portfolio analytics?
Portfolio analytics helps investors visualize holdings, performance, allocation, dividend income, and investment results.
Does Zavzu provide portfolio visualizations?
Yes, Zavzu provides clear portfolio visualizations and analytics to help investors understand their investments.
Can portfolio analytics help with dividend tracking?
Yes, Zavzu combines portfolio analytics with dividend tracking so investors can understand both performance and income.